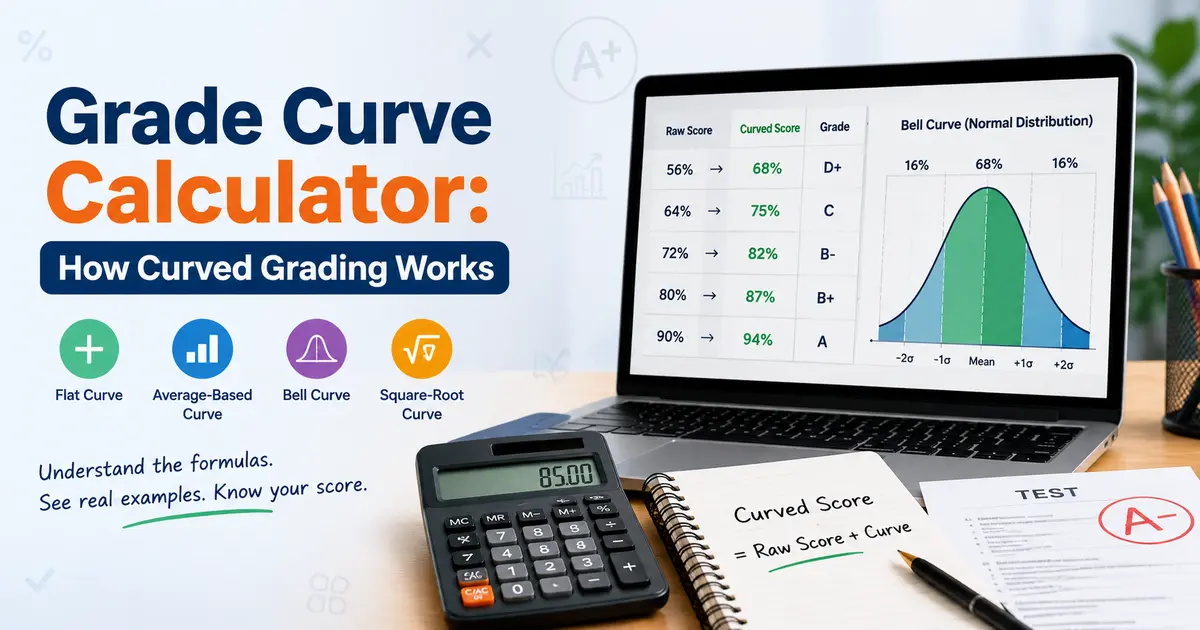
A grade curve calculator helps you estimate how your raw test score may change when a teacher adjusts grades using a curve.
That matters because your original score is not always the final score recorded in the gradebook. If a test was harder than expected, the class average was unusually low, or the instructor wants grades to match a target distribution, curved grading may raise scores. In some systems, it may also change how letter grades are assigned compared with a normal percentage scale.
The confusing part is this: “grading on a curve” does not always mean the same thing.
Sometimes it means adding the same number of points to everyone’s score. Sometimes it means adjusting scores based on the class average. Sometimes it means using a bell curve with mean and standard deviation. Some teachers even use a square-root curve to give lower scores a bigger boost without adding the same number of points to every student.
This guide explains the most common curved grading methods, the formulas behind them, examples, edge cases, and when to use a curve grade calculator instead of doing the math by hand.
Key Takeaways
- A grade curve adjusts raw scores after a test, quiz, exam, or assignment.
- The easiest curve is a flat curve, where every student gets the same point increase.
- An average-based curve raises the class average to a target average.
- A bell curve grade calculator uses the class mean and standard deviation to compare scores.
- A square-root curve gives a larger boost to lower scores and a smaller boost to higher scores.
- Curved grades depend on the method your teacher uses, so always check the syllabus or grading policy.
- A grade curve calculator estimates the adjusted score, but the official grade still comes from your instructor or school.
What Is a Grade Curve?
A grade curve is a grading adjustment that changes raw scores after an assessment.
For example, if the highest test score was 88%, a teacher might decide the test was too difficult and add 12 points to every student’s score. In that case, a student who earned 76% would receive an adjusted score of 88%.
That is one type of curve, but it is not the only one.
In general, curved grading tries to solve one of these problems:
- The test was harder than expected.
- The class average was lower than the teacher wanted.
- The instructor wants grades to reflect relative performance.
- The school uses a distribution-based grading policy.
- The raw scores do not match the intended difficulty level.
A grade curve calculator is useful because it shows what your adjusted grade may look like under different curve methods.
Curved Grading vs Regular Grade Calculation
A regular grade calculation uses your score as it is. If you earned 78 out of 100, your grade is 78%.
Curved grading changes that score after looking at the test, class results, or grading method.
| Grade Type | How It Works | Example |
|---|---|---|
| Regular grade | Uses your raw score | 78 out of 100 = 78% |
| Flat curve | Adds the same points to everyone | 78% + 8 points = 86% |
| Average-based curve | Moves the class average to a target | Class average 68% becomes 75% |
| Bell curve | Uses mean and standard deviation | Your score is compared to the class distribution |
| Square-root curve | Applies a formula to boost lower scores | 64% becomes 80% |
This is also why a grade on a curve calculator is different from a standard grade calculator. A standard grade calculator helps with weighted coursework, while a grade curve calculator estimates how a score changes after a curve is applied.
Why Teachers Use Grade Curves
Teachers usually curve grades when raw scores do not reflect the intended difficulty or performance level.
For example, if most students score much lower than expected, the teacher may decide the exam was too hard, too long, or not aligned well enough with the material taught in class.
A curve can also help when the instructor wants the average score to land near a specific target, such as 75% or 80%.
That said, curved grading is not magic. It can help correct a tough exam, but it can also create confusion if students do not know which method is being used. A clean grading policy beats mystery math every time.
Common Grade Curve Methods
There are four common methods students usually need to understand:
- Flat curve
- Average-based curve
- Bell curve
- Square-root curve
Each method answers a different question.
| Curve Method | Best For | Main Input Needed |
|---|---|---|
| Flat curve | Simple point adjustment | Bonus points |
| Average-based curve | Raising the class average | Current average and target average |
| Bell curve | Ranking scores by class distribution | Mean and standard deviation |
| Square-root curve | Boosting lower scores more | Raw score percentage |
Let’s break them down clearly.
Method 1: Flat Grade Curve
A flat curve adds the same number of points to every student’s score.
This is the simplest method and the one many students think of first when they hear “curve.”
Flat Curve Formula
Curved Grade = Raw Grade + Added Points
Flat Curve Example
Let’s say your raw test score is 76%, and your teacher adds 8 points to every score.
Curved Grade = 76 + 8
Curved Grade = 84%
Your adjusted grade becomes 84%.
| Raw Score | Added Points | Curved Score |
|---|---|---|
| 62% | 8 | 70% |
| 76% | 8 | 84% |
| 88% | 8 | 96% |
| 95% | 8 | 100% or 103%, depending on policy |
The last row shows an important edge case. Some teachers cap curved scores at 100%. Others may allow extra credit above 100%. Students should check the official course policy.
When a Flat Curve Works Best
A flat curve works best when the teacher believes the test was too hard by a fixed amount.
For example, if one question was poorly worded or a topic was not covered clearly, adding the same number of points may be fair.
Main Limitation
A flat curve helps every student equally in points, but not equally in impact.
A student moving from 58% to 66% may still fail, while a student moving from 88% to 96% may jump into an A range. Same points, different outcome. Classic grading drama.
Method 2: Average-Based Grade Curve
An average-based curve adjusts scores so the class average reaches a target average.
This method is common when a teacher wants the class average to land at a specific level, such as 75%.
A grade curve calculator using average usually needs two numbers:
- Current class average
- Target class average
Average-Based Curve Formula
Curve Points = Target Average - Current Class Average
Curved Grade = Raw Grade + Curve Points
Average-Based Curve Example
Suppose the class average is 68%, and the teacher wants the average to be 75%.
Curve Points = 75 - 68
Curve Points = 7
Now add 7 points to each student’s raw score.
| Raw Score | Curve Points | Curved Score |
|---|---|---|
| 55% | 7 | 62% |
| 68% | 7 | 75% |
| 81% | 7 | 88% |
| 92% | 7 | 99% |
This is why students often search for a grade curve calculator based on average or a grade curve calculator class average method. They want to know how much their score changes when the teacher moves the class average upward.
When an Average-Based Curve Works Best
This method works best when the instructor wants to correct the overall difficulty of the assessment without changing the relative order of students.
If you scored higher than another student before the curve, you still score higher after the curve.
Main Limitation
An average-based curve depends heavily on the class average. If the class average is already high, there may be no curve at all.
For example:
| Current Class Average | Target Average | Curve Points |
|---|---|---|
| 68% | 75% | +7 |
| 73% | 75% | +2 |
| 78% | 75% | 0 or no curve |
Most teachers will not subtract points just because the class average is above the target, but some strict curve systems can adjust grades downward. Again, syllabus rules matter.
Method 3: Bell Curve Grading
A bell curve grade calculator uses class performance to place scores into a distribution.
This method is more statistical than a flat curve or average-based curve. It uses the mean and standard deviation to understand how far your score is from the class average.
In statistics, a z-score tells how many standard deviations a value is above or below the mean. OpenStax explains that positive z-scores are above the mean, negative z-scores are below the mean, and a z-score of zero means the value equals the mean.
Bell Curve Formula
Z-Score = (Raw Score - Class Mean) ÷ Standard Deviation
Then the z-score can be mapped to a curved grade or letter grade scale.
Bell Curve Example
Let’s say:
| Input | Value |
|---|---|
| Your raw score | 84% |
| Class mean | 72% |
| Standard deviation | 8 |
Now calculate the z-score:
Z-Score = (84 - 72) ÷ 8
Z-Score = 12 ÷ 8
Z-Score = 1.5
Your score is 1.5 standard deviations above the class average.
That usually means your performance was well above average, even if 84% does not look perfect on a normal scale.
Example Bell Curve Letter Grade Mapping
Different teachers use different mappings, but here is a simple example:
| Z-Score Range | Relative Performance | Possible Letter Grade |
|---|---|---|
| +1.5 or higher | Far above average | A |
| +0.5 to +1.49 | Above average | B |
| -0.5 to +0.49 | Near average | C |
| -1.5 to -0.51 | Below average | D |
| Below -1.5 | Far below average | F |
This is where a grade curve calculator with mean and a grade curve calculator with standard deviation become useful. You are not just asking, “What was my score?” You are asking, “How did my score compare with the class?”
When Bell Curve Grading Works Best
Bell curve grading is usually used when the instructor wants grades to reflect relative performance across a class.
It may be more common in large classes because larger groups can make score distributions more stable. However, bell curve grading can be controversial because students are compared against classmates, not just against a fixed standard.
Main Limitation
Bell curves can feel unfair in small classes.
If only 10 students took the exam, one unusually high or low score can distort the average and standard deviation. In a small class, the numbers can get weird fast. Math is useful, but it is not a priesthood.
Method 4: Square-Root Grade Curve
A square-root curve adjusts scores using the square root of the raw score percentage.
This method often gives a bigger boost to lower scores while giving a smaller boost to higher scores.
Square-Root Curve Formula
Curved Grade = √Raw Grade × 10
This formula assumes the raw grade is written as a percentage from 0 to 100.
Square-Root Curve Example
Let’s say your raw grade is 64%.
Curved Grade = √64 × 10
Curved Grade = 8 × 10
Curved Grade = 80%
So, a 64% becomes an 80%.
Here are more examples:
| Raw Score | Square Root | Curved Score |
|---|---|---|
| 36% | 6 | 60% |
| 49% | 7 | 70% |
| 64% | 8 | 80% |
| 81% | 9 | 90% |
| 100% | 10 | 100% |
This is why students search for a square root grade curve calculator. The adjustment is not a simple point increase. It is formula-based.
When a Square-Root Curve Works Best
A square-root curve is often used when scores are very low and the instructor wants to raise them without giving the same point bonus to everyone.
It can be generous for lower scores. For example, 49% becomes 70%, which is a 21-point increase.
Main Limitation
The square-root curve can change the meaning of scores sharply.
A student with 36% can move to 60%, while a student with 81% moves to 90%. That may or may not match the teacher’s idea of fairness.
Quick Comparison of Grade Curve Methods
| Method | Formula | Best Use Case | Biggest Risk |
|---|---|---|---|
| Flat curve | Raw Grade + Points | Simple correction | May over-boost high scores |
| Average-based curve | Raw Grade + (Target Avg - Current Avg) | Raising class average | Depends on class average |
| Bell curve | (Score - Mean) ÷ SD | Relative class ranking | Can feel unfair in small classes |
| Square-root curve | √Raw Grade × 10 | Helping low scores recover | Can create big score jumps |
Which Grade Curve Method Should You Use?
Use the method your teacher or syllabus gives you.
If the teacher says “I added 6 points,” use the flat curve method.
If the teacher says “I curved the average to 75,” use the average-based method.
If the teacher gives a mean and standard deviation, use the bell curve method.
If the teacher says scores were square-root curved, use the square-root formula.
If you are not sure, use the grade curve calculator to test different methods and compare possible results.
How to Calculate a Curved Grade Step by Step
Here is a simple process you can follow.
Step 1: Write Down Your Raw Score
Start with your original test, quiz, exam, or assignment score.
Example:
Raw Score = 78%
Step 2: Identify the Curve Method
Look for clues from your teacher:
| Teacher Says | Likely Method |
|---|---|
| “Everyone gets 5 points back” | Flat curve |
| “I raised the class average to 75” | Average-based curve |
| “Grades are based on the distribution” | Bell curve |
| “I used the square-root curve” | Square-root curve |
Step 3: Apply the Formula
Use the correct formula for the method.
For example, if the curve adds 7 points:
Curved Grade = 78 + 7
Curved Grade = 85%
Step 4: Check the Grade Cap
Some classes cap grades at 100%.
So if your curved score is 104%, your official score may still be 100%.
Step 5: Compare With the Letter Grade Scale
Finally, check how your curved percentage maps to a letter grade.
A common scale is:
| Percentage | Letter Grade |
|---|---|
| 90% to 100% | A |
| 80% to 89% | B |
| 70% to 79% | C |
| 60% to 69% | D |
| Below 60% | F |
Your school may use a different scale, so always follow the official grading policy.
Full Example: Curving a Test Grade
Let’s say you earned 74% on a test.
The class average was 66%, and the teacher wants to curve the average to 75%.
Step 1: Find the Curve Points
Curve Points = Target Average - Current Average
Curve Points = 75 - 66
Curve Points = 9
Step 2: Add the Curve Points to Your Score
Curved Grade = Raw Grade + Curve Points
Curved Grade = 74 + 9
Curved Grade = 83%
Your curved test grade is 83%.
Step 3: Compare Before and After
| Score Type | Grade |
|---|---|
| Raw test score | 74% |
| Curve added | 9 points |
| Curved test score | 83% |
That changes the result from a C range to a B range on many common grading scales.
Edge Cases Students Should Know
Curved grading sounds simple until the edge cases show up. Here are the big ones.
1. Can a Curved Grade Go Above 100%?
Yes, mathematically it can.
If your raw score is 96% and the curve adds 8 points, your calculated score is 104%.
But your teacher may cap the score at 100%.
2. Can a Curve Lower Your Grade?
Usually, student-friendly curves only raise grades. However, strict bell curve systems can lower outcomes if grades must fit a required distribution.
For example, if many students score high, a strict curve may make an 88% less impressive than it would be on a fixed scale.
3. What If the Class Average Is Already High?
If the class average is already above the target average, an average-based curve may add nothing.
Example:
| Current Average | Target Average | Curve |
|---|---|---|
| 82% | 75% | No upward curve |
4. What If the Standard Deviation Is Very Small?
A small standard deviation means most scores are close together.
In bell curve grading, this can make small score differences matter more than students expect.
For example, if the standard deviation is only 3 points, scoring 6 points above average puts you 2 standard deviations above the mean.
5. What If the Class Is Very Small?
Bell curves are weaker in small classes because one or two unusual scores can shift the average.
For small classes, a flat curve or average-based curve is usually easier to understand.
6. Does Curving Change Class Rank?
It depends on the method.
A flat curve does not change rank because everyone gets the same point increase.
A square-root curve can narrow the gap between lower and higher scores.
A bell curve may change how letter grades are assigned based on relative performance.
Grade Curve Calculator vs Grade Calculator
Use a grade curve calculator when you want to estimate an adjusted score after a curve.
Use a regular grade calculator when you want to calculate your current class grade from homework, quizzes, exams, projects, and weights.
| Tool | Use It For | Example Question |
|---|---|---|
| Grade curve calculator | Curved test or exam scores | “What is my score after the curve?” |
| Grade calculator | Weighted course grade | “What is my current class grade?” |
| Final grade calculator | Final exam target | “What do I need on my final?” |
| GPA calculator | Grade point average | “What is my GPA this semester?” |
If your teacher has already posted the curved score and you want to calculate your overall class grade, use the standard Grade Calculator. If you are trying to estimate the curve itself, use the grade curve calculator instead.
Common Mistakes When Calculating Curved Grades
Mistake 1: Assuming Every Curve Adds Points
Not every curve is a flat point boost. A bell curve may compare your score to the class distribution. A square-root curve uses a formula. An average-based curve depends on the current class average.
Mistake 2: Ignoring the Grade Cap
If your calculated curved grade is 105%, your official grade may still be capped at 100%.
Mistake 3: Mixing Up Percentage Points and Percent Increase
Adding 10 percentage points to 70% gives 80%.
Increasing 70% by 10% gives 77%.
Those are not the same thing.
Mistake 4: Using the Wrong Average
For average-based curves, you need the class average for that specific test or assignment, not your personal course average.
Mistake 5: Treating the Estimate as Official
A calculator can estimate the curve, but your teacher’s posted grade is the official one.
When Should You Use a Grade Curve Calculator?
Use a grade curve calculator when:
- Your teacher announced a curve but did not show your adjusted score yet.
- You know the class average and target average.
- You want to compare flat curve, bell curve, and square-root curve methods.
- You want to understand how much a curve may affect your test grade.
- You are trying to estimate whether your letter grade may change.
- You want to check the math before asking your teacher for clarification.
A calculator is especially helpful when the curve involves class average, mean, or standard deviation. Those formulas are easy to mess up manually.
Final Thoughts
A grade curve calculator helps you understand how curved grading may change your raw score, but the method matters more than the word “curve.”
A flat curve adds points. An average-based curve moves the class average. A bell curve compares your score with the mean and standard deviation. A square-root curve uses a formula that gives lower scores a larger boost.
The smartest move is simple: find out which curve method your teacher uses, enter the correct numbers, and compare the result before assuming your grade will jump.
Use the Grade Curve Calculator to estimate your curved score, then check your syllabus or official gradebook for the final result.
FAQs
What is a grade curve calculator?
A grade curve calculator is a tool that estimates an adjusted grade after a teacher applies a curve. It can help calculate flat curves, average-based curves, bell curve adjustments, and square-root curve grades.
How does a grade curve calculator work?
A grade curve calculator works by applying a curve formula to your raw score. The formula depends on the curve method. A flat curve adds points, an average-based curve uses the class average, a bell curve uses mean and standard deviation, and a square-root curve uses the square root of your raw score.
What is the easiest way to curve a grade?
The easiest way to curve a grade is to add the same number of points to every score. The formula is: Curved Grade = Raw Grade + Added Points.
What is a curve grade calculator?
A curve grade calculator is another name for a grade curve calculator. It helps estimate what a test, quiz, exam, or assignment score may become after curved grading.
What is a bell curve grade calculator?
A bell curve grade calculator estimates curved grades using class distribution. It usually uses the class mean and standard deviation to see how far your score is above or below the average.
How do you calculate a grade curve using class average?
To calculate a grade curve using class average, subtract the current class average from the target average. Then add the difference to each raw score. For example, if the class average is 68% and the target is 75%, the curve adds 7 points.
What is a grade curve calculator with mean?
A grade curve calculator with mean uses the class average, also called the mean, to adjust scores. In bell curve grading, the mean helps show whether your score is above, below, or near the class average.
What is a grade curve calculator with standard deviation?
A grade curve calculator with standard deviation uses the spread of class scores to calculate relative performance. Standard deviation shows how much scores vary from the class mean.
How does a square root grade curve calculator work?
A square root grade curve calculator uses this formula: Curved Grade = √Raw Grade × 10. For example, a raw score of 64% becomes 80% because √64 = 8, and 8 × 10 = 80.
Can a curved grade go over 100%?
Yes, a curved grade can go over 100% mathematically, but many teachers cap scores at 100%. Whether scores above 100% count depends on the course policy.
Can grading on a curve hurt your grade?
In many classes, curves only raise grades. In strict bell curve systems, however, your letter grade may depend on how your score compares with classmates. That can sometimes make a high raw score less valuable if many students scored higher.
Is grading on a curve the same as extra credit?
No. Extra credit usually adds optional points for extra work. A curve adjusts scores based on the test, class average, or score distribution.
Is a test grade curve calculator different from a final grade calculator?
Yes. A test grade curve calculator estimates an adjusted test score after a curve. A final grade calculator estimates what score you need on a final exam to reach a target course grade.
Should students rely on curved grade estimates?
Students can use curved grade estimates for planning, but the official grade always depends on the teacher, syllabus, school policy, rounding rules, and gradebook settings.