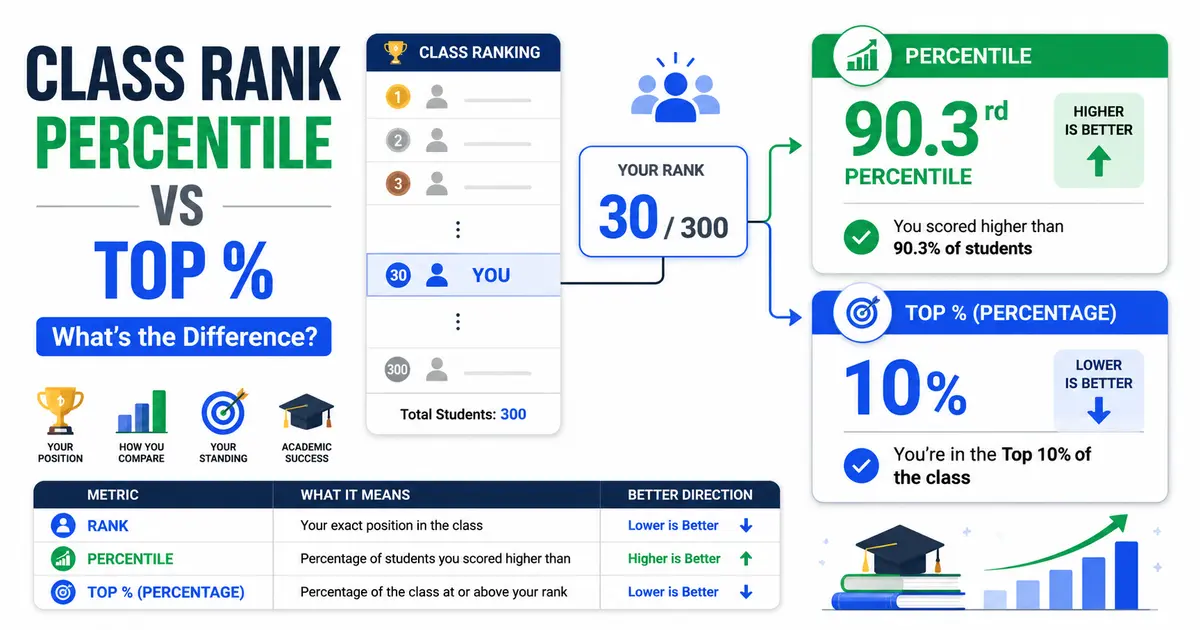
Percentile tells you what percentage of your class you scored higher than, so a higher number is better. Percentage and top percent both describe which group you fall within, counted from the top, so a lower number is better. Ranked 30th in a class of 300 puts a student in the top 10 percent, which is roughly the 90th percentile. These describe the same standing from two directions, and while they’re close, they aren’t always mathematically identical, for reasons this guide explains in full.
If you already have your rank and class size, the class rank calculator converts all three figures for you at once. The rest of this guide walks through exactly what each term means and how the conversion works, so the number you get back actually makes sense.
The Three Terms, Defined
| Term | What It Measures | Direction | Example (Rank 30 of 300) |
|---|---|---|---|
| Percentile | The share of your class you scored higher than | Higher is better | 90.3rd percentile |
| Percentage (Top %) | Which group you fall in, counted from the top down | Lower is better | Top 10 percent |
| Raw Rank | Your exact numbered position in the class | Lower number is better | 30 out of 300 |
All three come from the same two inputs, your position and your class size, but they answer different questions. Percentile answers “how many classmates did I outperform.” Top percent answers “what tier am I in.” Raw rank is just the position itself, before either conversion is applied.
The Exact Formulas
Rank to percentile (the same method used on our calculator): Class Rank Percentile = ((Total Students − Your Rank + 1) ÷ Total Students) × 100
The “+1” matters. It counts your own position as part of the group you’re being measured against, which is the convention most calculators and school reporting systems use. Leaving it out understates your percentile slightly, especially in a smaller class.
Rank to top percent: Top Percent = (Your Rank ÷ Total Students) × 100
Percentile back to rank: Rank = Total Students − (Percentile ÷ 100 × Total Students) + 1
Worked Examples
Example 1: Rank 50 of 500
((500 − 50 + 1) ÷ 500) × 100 = 90.2 percent
This student sits around the 90th percentile, which puts them in the top 10 percent of their class.
Example 2: Rank 25 of 300
((300 − 25 + 1) ÷ 300) × 100 = 92 percent
That’s about the 92nd percentile, or the top 8.3 percent of the class.
Example 3: Rank 30 of 300
((300 − 30 + 1) ÷ 300) × 100 = 90.3 percent, and top percent = (30 ÷ 300) × 100 = 10 percent.
Enter any of these same numbers into the class rank calculator to confirm the result and see your standing described both ways at once.
Quick Reference by Rank and Class Size
| Rank | Class Size 200 | Class Size 400 | Class Size 600 |
|---|---|---|---|
| Top 20 | 90.5th percentile / top 10% | 95.25th percentile / top 5% | 96.8th percentile / top 3.3% |
| Top 50 | 75.5th percentile / top 25% | 87.75th percentile / top 12.5% | 91.8th percentile / top 8.3% |
| Top 100 | 50.5th percentile / top 50% | 75.25th percentile / top 25% | 83.5th percentile / top 16.7% |
Percentage vs. Percentile, Side by Side
| Term | What It Means | Better Result |
|---|---|---|
| Class rank | Your position in class, such as 25 out of 300 | Lower is better |
| Class rank percentile | The percentage of students you rank above | Higher is better |
| Top percentage | The percentage of the class at or above your rank | Lower is better |
A Common Source of Confusion: “Percentage” Doesn’t Always Mean the Same Thing
Part of why these three terms get mixed up isn’t just the student’s fault. Some academic sites use the word “percentage” to mean percentile (the share of the class you outperformed), while others use the exact same word to mean top percent (the share of the class at or above you), which are opposite directions. If you’re reading a result on a form, a transcript, or another website and it just says “percentage” without defining which direction it runs, check whether a lower or higher number is being treated as better before assuming which one you’re looking at. On this page, “percentile” always means higher is better, and “top percent” or “percentage” both mean lower is better, matching the terms used on our class rank calculator.
Where Percentile and Top Percent Are Not Exact Mirror Images
This is the part almost no competing guide explains, and it’s worth understanding if you’re ever comparing a number your school reports against one you calculated yourself.
In a clean, tie-free class, percentile and top percent land close to complementary: a 90th percentile and a top 10 percent standing describe almost the identical position. In practice, three things can make the two figures diverge slightly:
- Tied GPAs. When several students share the exact rank, whether they all count as being inside a top group or split around its edge depends on how the school’s system counts ties, and that isn’t standardized between schools.
- Inclusive vs. exclusive counting. Some formulas count “students strictly below you,” while others, including ours, count your own position as part of the total using the “+1” convention. Our calculator methodology page covers this in more general terms: when more than one mathematical convention exists, the result depends on which one a given tool or school has chosen.
- Rounding at small class sizes. In a class of 40, a single-rank difference is worth 2.5 percentage points. A student ranked 4th could reasonably be described as either “top 10 percent” or “90th percentile,” and the two won’t always land on exactly the same figure the way they do in a large class.
None of this changes the practical takeaway. A strong rank is a strong rank either way. But it explains why a student might see slightly different percentile numbers from a school counselor, a college application platform, and an online calculator, even when the underlying rank and class size are identical.
A Number That Changes More Than Students Expect: Class Size
Every formula above depends on total class size, and that figure isn’t as fixed as it feels like it should be. Enrollment counted at the start of senior year can shrink by graduation due to transfers, early graduation, or students moving to alternative programs. A rank of 50 out of 520 is a top 9.6 percent standing, but the same rank of 50 out of 480 is a top 10.4 percent standing, a difference that can matter right at an admissions or scholarship cutoff.
If a percentile or top-percent figure needs to be exact, for a state auto-admission program or a scholarship application, confirm the class size your school is using at that specific moment, rather than assuming it matches an earlier count from junior year or the start of senior year.
Common Mistakes When Converting Rank, Percentile, and Top Percent
- Assuming percentile and top percent are always exact opposites. They’re close in most classes but can diverge slightly from ties, rounding, or counting convention, as explained above.
- Using an outdated class size. Enrollment shrinks between the start of senior year and graduation more often than students expect. Recalculate with the current official count before relying on a result.
- Mixing weighted and unweighted GPA when the rank was based on the other. A percentile or top-percent figure is only as accurate as the rank it started from, and rank itself depends on which GPA scale a school actually used.
- Treating “percentage” as if it always means the same thing. As covered above, some sources use it for percentile, others for top percent. Confirm the direction before comparing two numbers from different sources.
- Reporting a self-calculated conversion instead of the school’s official figure. Use your own math to understand a number, not to override what your transcript or counselor reports on an application.
Why This Distinction Matters for Admissions and Scholarships
Colleges and scholarship committees don’t always ask for the same format. Some request an exact rank, some ask for a decile or quartile, and some just want to know whether a student falls in the top 10 or top 25 percent. According to the National Association for College Admission Counseling’s most recent review of admission factors, grades in college-prep courses and overall strength of curriculum carry far more weight than class rank at most four-year colleges today, which is part of why fewer schools report an exact number and more report a broader band instead (NACAC, Factors in the Admission Decision).
The National Association of Secondary School Principals notes a related limitation: because rank only compares a student against classmates at their own school, it becomes less useful once admissions officers are comparing applicants across very different high schools, which is one reason many colleges lean on percentile or band-based reporting instead of a single exact position (NASSP, Class Rank). Knowing how to convert between rank, percentile, and top percent means a student can answer whichever format a specific application actually asks for, instead of guessing.
Which Format Should You Report on an Application?
Use whatever your school’s official record provides. If your school reports an exact numbered rank, report that. If it reports a decile, quintile, or quartile instead, that’s effectively the top-percent format grouped into bands. If it reports only a percentile, use that number as given. Colleges are used to seeing all of these formats and generally understand how to interpret each one. The important part is reporting exactly what your school’s official record shows rather than converting it yourself into a different format, unless a specific form asks for a different one.
For the full mechanics of how a school arrives at that number in the first place, including how ties are broken and how weighted versus unweighted GPA changes the result, see how to calculate class rank.
Frequently Asked Questions
Is a higher percentile always better?
Yes. Percentile measures the share of your class you scored higher than, so a higher percentile always reflects a stronger standing.
Is top percent the same as percentile?
They’re close but not always identical. In a class with no tied ranks, a 90th percentile and a top 10 percent standing describe close to the same position. Ties, rounding at small class sizes, and whether a formula counts your own rank as part of the total can cause the two figures to diverge slightly.
How do I convert my rank into a percentile?
Use ((Total Students − Your Rank + 1) ÷ Total Students) × 100. Ranked 25th in a class of 300 gives a 92nd percentile.
How do I convert my rank into a top percentage?
Use (Your Rank ÷ Total Students) × 100. Ranked 30th in a class of 300 gives a top 10 percent standing.
Why might my calculated percentile not match what my school reports?
Small differences usually come from how tied ranks are counted, whether the formula counts your own rank as part of the total, and whether the class size used matches your school’s current, official enrollment count.
Which number should I put on a college application?
Report whatever format your school’s official transcript or counselor provides. Only convert it yourself if the application specifically asks for a different format than what your school reports. For a full walkthrough of how StudentCalcTools approaches class rank, GPA, and related planning estimates, browse the full calculator collection.